Program Analytics That Show
How Delivery Actually Happened
One workspace. Complete visibility across feature progress, team performance, scope changes, and PI execution.

Every Delivery Metric Your Program Needs.
Kendis Analytics consolidates program-level agile reporting into a single, connected workspace — from the PI burndown to individual feature health and team reliability.
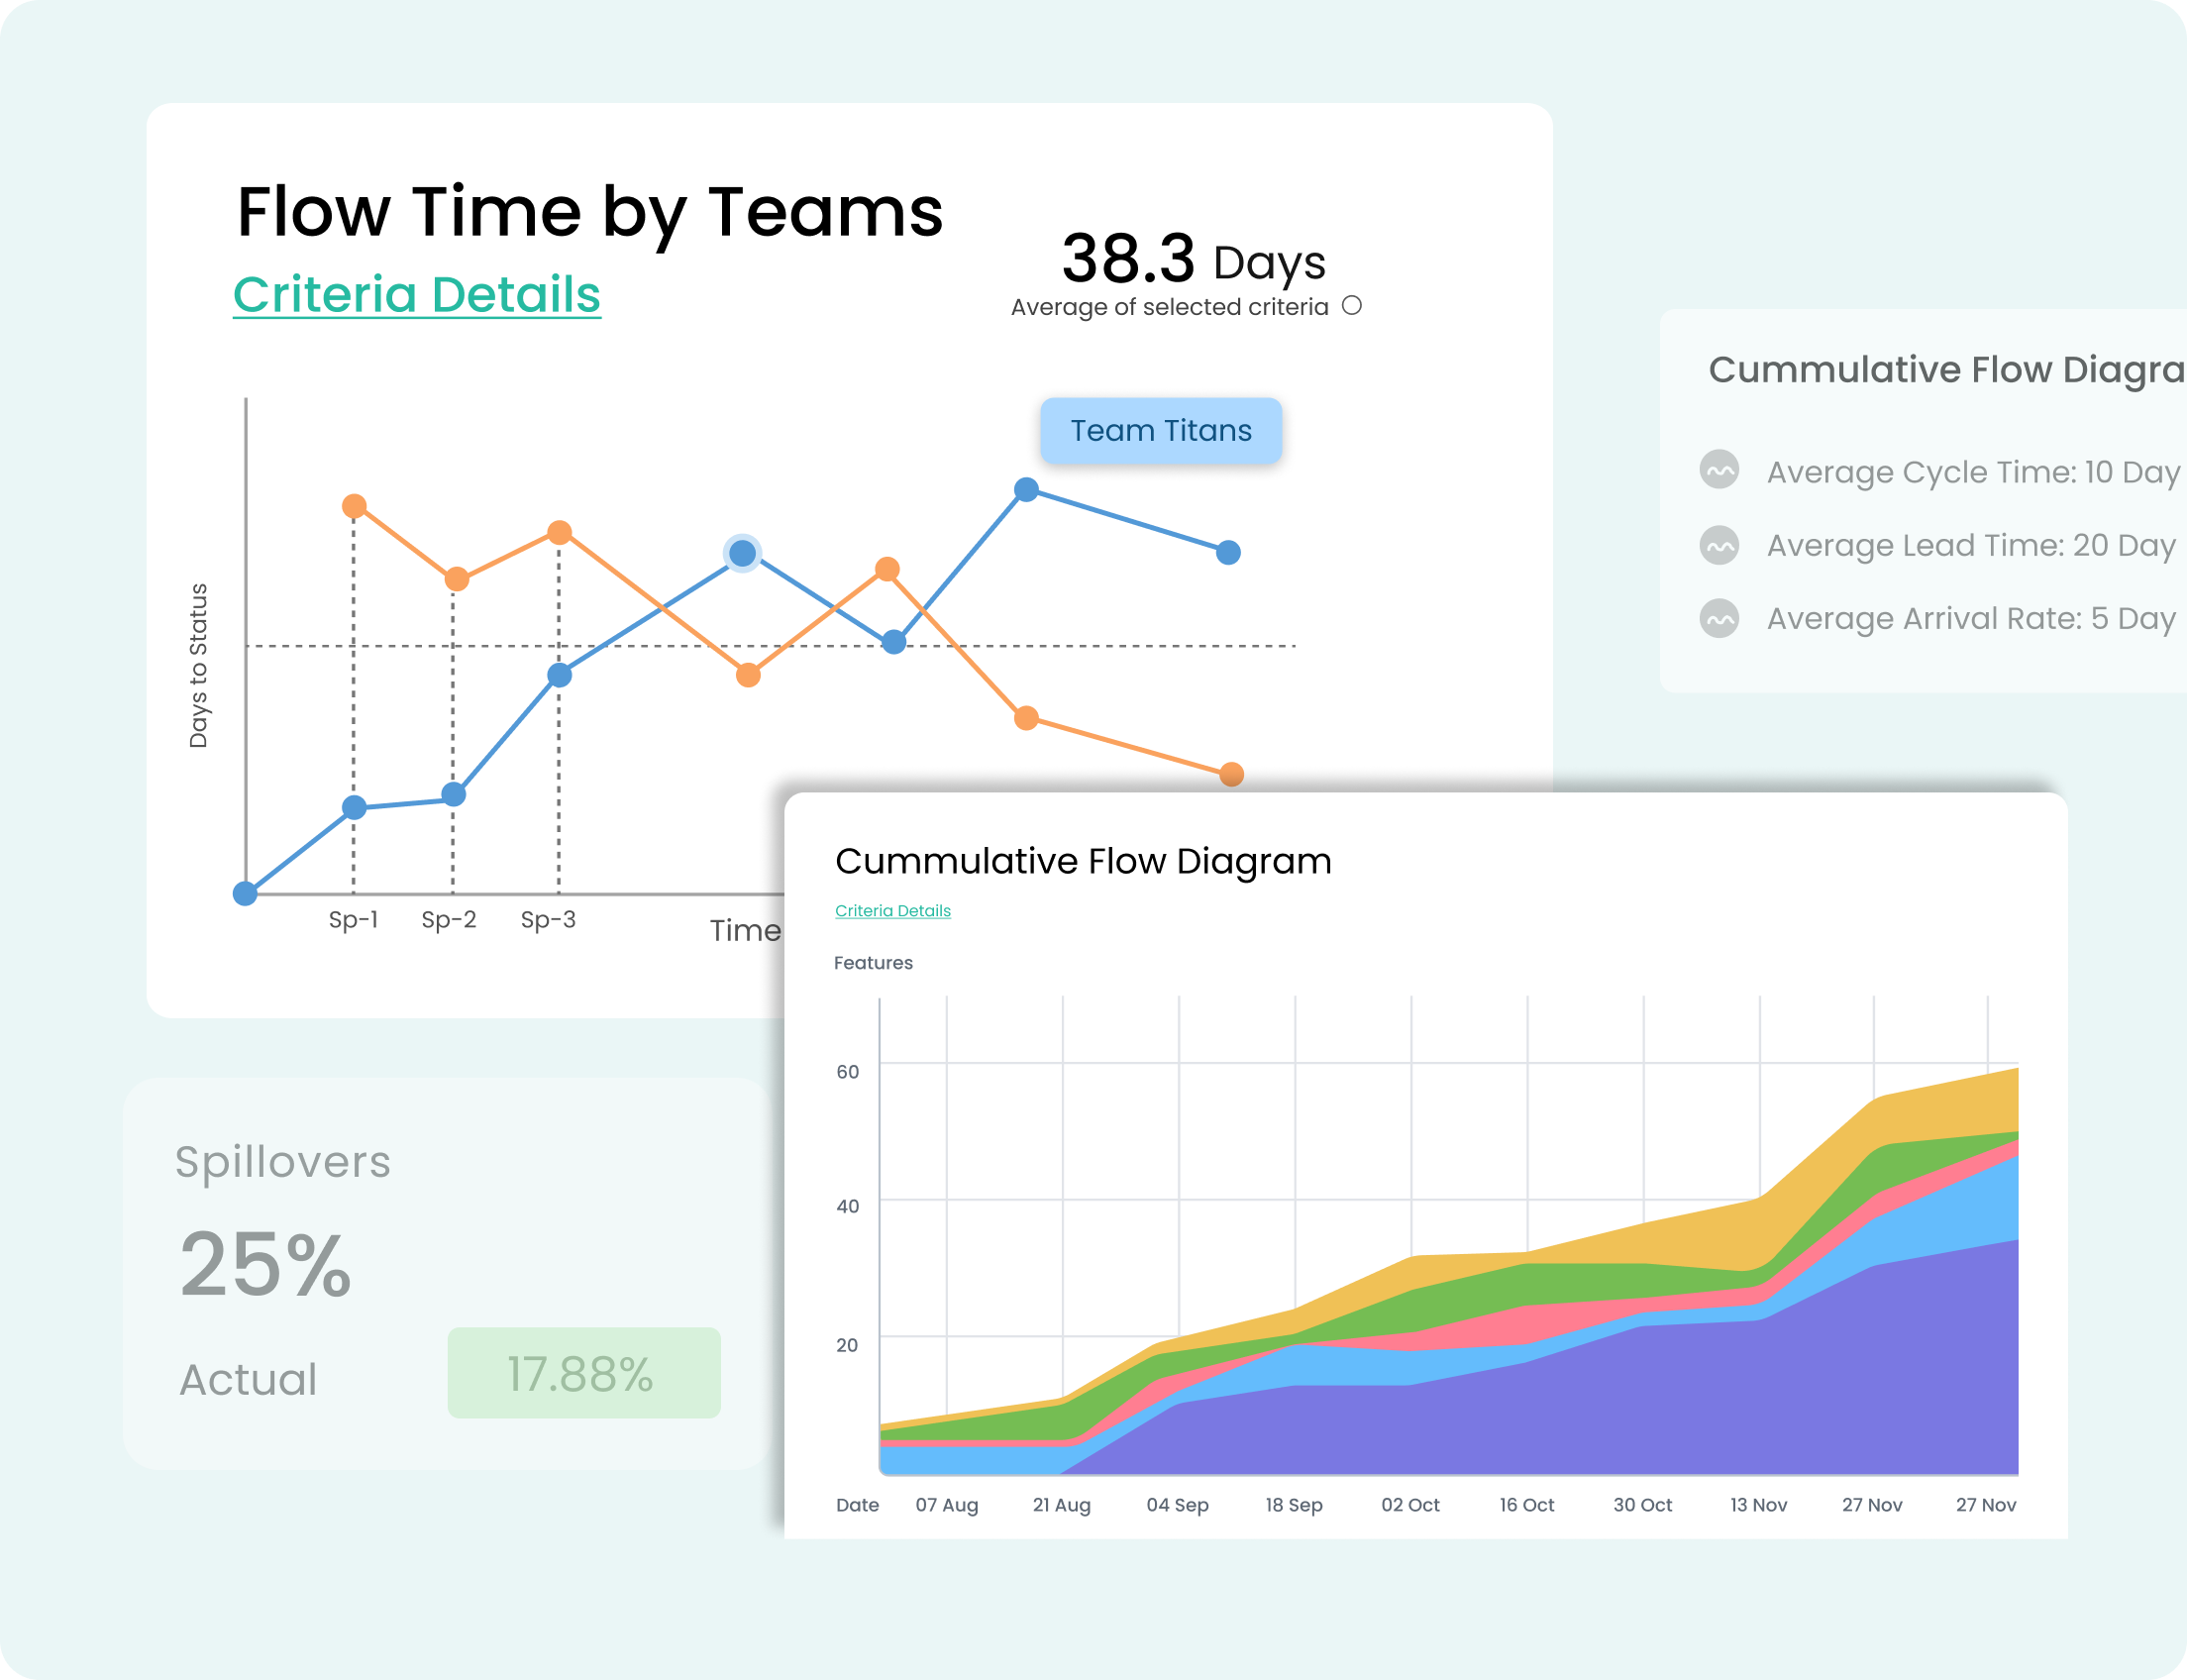
Feature Analytics
Burndown and burnup at feature level. Filter by Objectives, Milestones, Risks, WSJF, Epics, or any custom field.
Team Delivery
Sprint commitment, delivery gaps, velocity, and reliability — for every team, side by side.
Scope Changes
Story points added and removed since planning, visualized per sprint. Separate the moving goal from the execution miss.
Progress by Teams
Planned load, committed load, done points, and capacity — per team, per sprint. Spot over- and under-planning fast.
Delivery by Sprints
Cumulative planned and delivered across the full PI — iteration by iteration in a single scrollable view.
Configurable Calculations
Define which card types, statuses, and issue types count toward burndown and objectives.
Track Individual Features Across Sprint
Most tools show you if a feature is done. Kendis shows you how it got there — tracking every feature across sprints against the lens that matters to your stakeholders
Learn More

Sprint Committed Vs Actual Delivered
See how accurately each team committed at sprint start versus what they delivered.

Carry-Over & Unplanned Work Visibility
Carry-over tracking shows what spilled over and from where, & unplanned work that wasnt in the original plan.
Team Health & Delivery Gaps at a Glance
Delivery Gaps & Top Performers split view instantly highlights which teams are falling short and which are exceeding their commitments.

Track Progress in the Context That Matters to Your Business
Roll up delivery by Epic, OKR, Strategic Theme or custom dimension — the same data, sliced the way each stakeholder needs to see it.
- By Portfolio Epic
- By Strategic Theme
- By OKR / Objective
- By ART or Value Stream
- By any custom Jira field
Move From Reporting to Deciding
Stop building slides. Start shipping with confidence. See Kendis Program Analytics on your own Jira data in under 30 minutes.
Frequently Asked Questions
What is Features Analytics in Kendis?
Features Analytics is the view in Kendis that tracks every feature across the sprints it spans, showing committed scope, actual delivered scope, and any changes, so RTEs and product leaders can see exactly what shipped in each PI.
How is Program Analytics different from a standard Jira dashboard?
Jira dashboards report on issues. Program Analytics reports on delivery outcomes — features, objectives, business value and team commitments rolled up across multiple projects, teams and PIs, without manual gadgets or custom JQL.
Can I track feature delivery against PI Objectives and Milestones?
Yes. Every feature can be linked to PI objectives, milestones and strategic themes, and Kendis will show committed vs actual business value side-by-side.
What integrations does Kendis Analytics support?
Kendis pulls live data from Jira (Cloud, Data Center and Server) and Azure DevOps, so analytics always reflect the source of truth without manual exports.
Can we configure which metrics matter to our analytics and team dashboards?
Yes. Every metric — story points, hours, custom fields, business value, throughput — can be configured per ART or per program, so each team tracks what matters to them.